Official numbers on your market, your customers and your competition
Market size, growth, risk and scenarios for any industry in any country, built from official statistics, with the source and date on every figure.
Official numbers you can cite.
- 4.39 million sourced data points
- 8,900+ industry codes across 275 geographies
- read directly from Eurostat, the World Bank, the IMF, the OECD and other official publishers
Free to start. No card.
How it works
- Pick the industry by its official code and the country. Any of 8,900+ codes, any of 275 geographies.
- Read the market chapter, every figure with its source, date and grade.
- Take it with you: a file, or the API.
Your market slide, filled in.
Example throughout: bread, pastry and cakes manufacturing, Germany, 2023.
Market size
Your pitch needs a market size. What you can find is unsourced, contradicts itself, or sits in a report priced like a car.
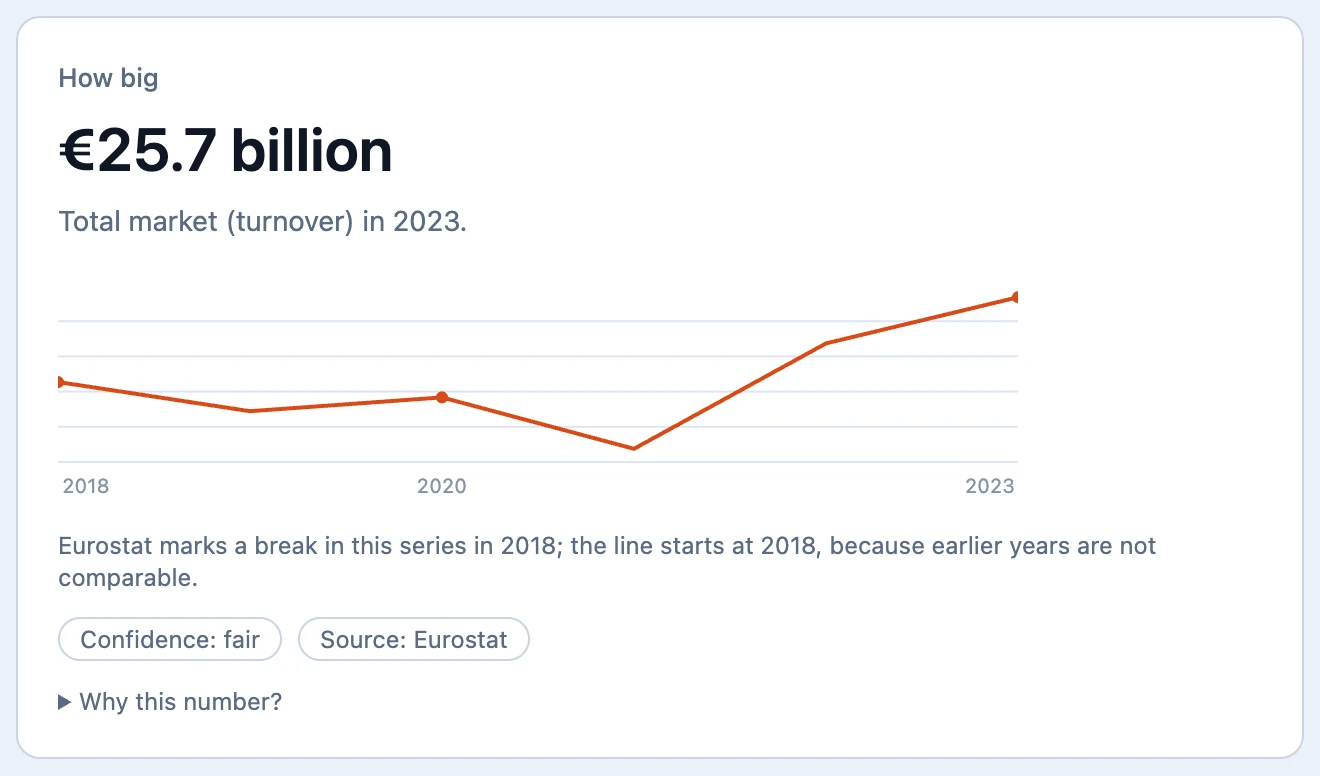
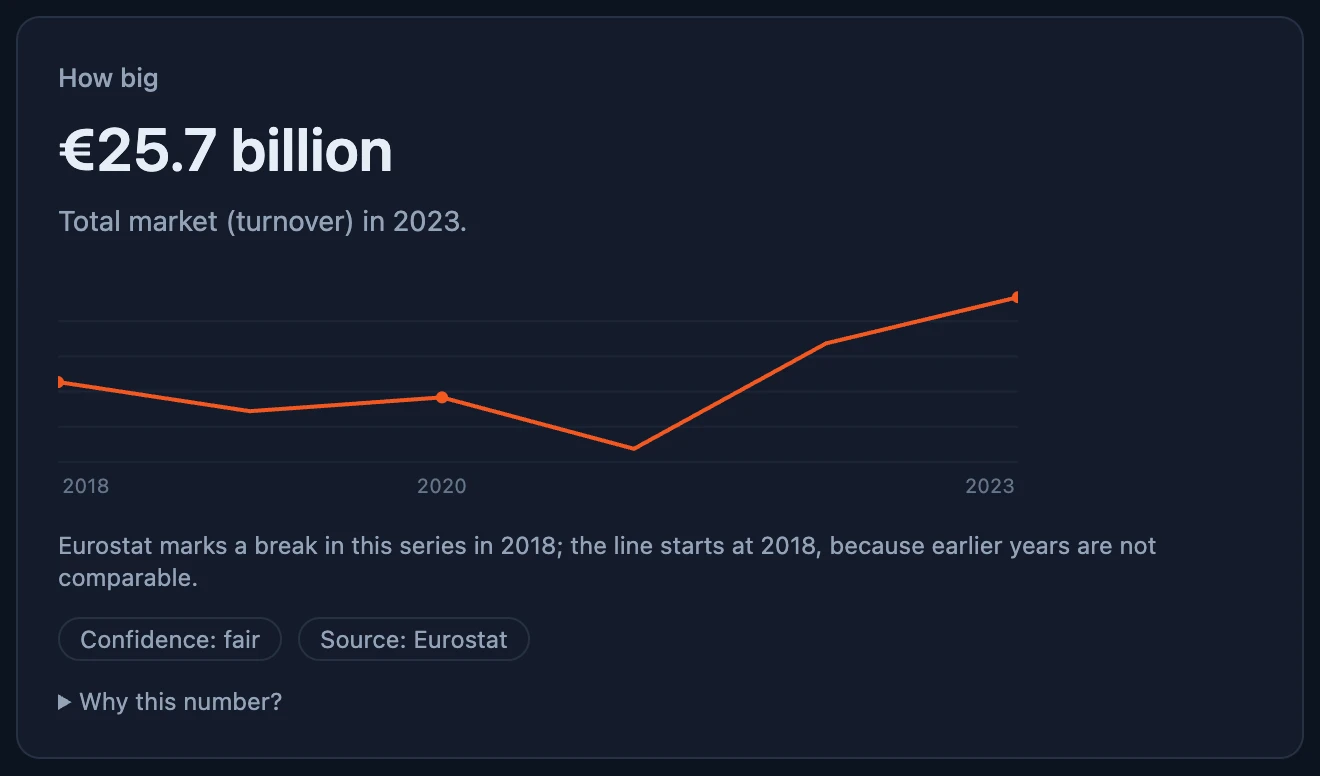
Type the industry and the country. The total (TAM) is that industry's official turnover, with the source and the year on it.
Germany, 2023: 25.72 bn EUR turnover (Eurostat).
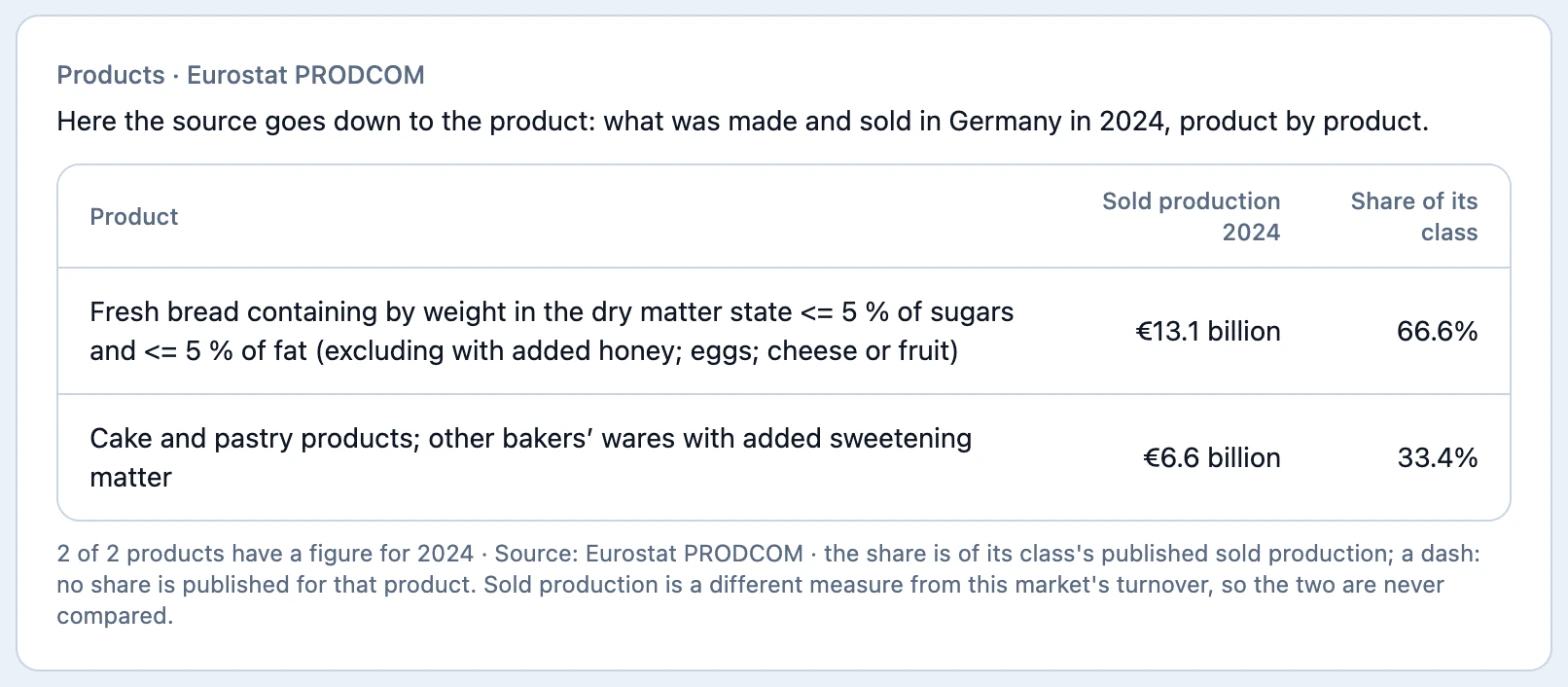
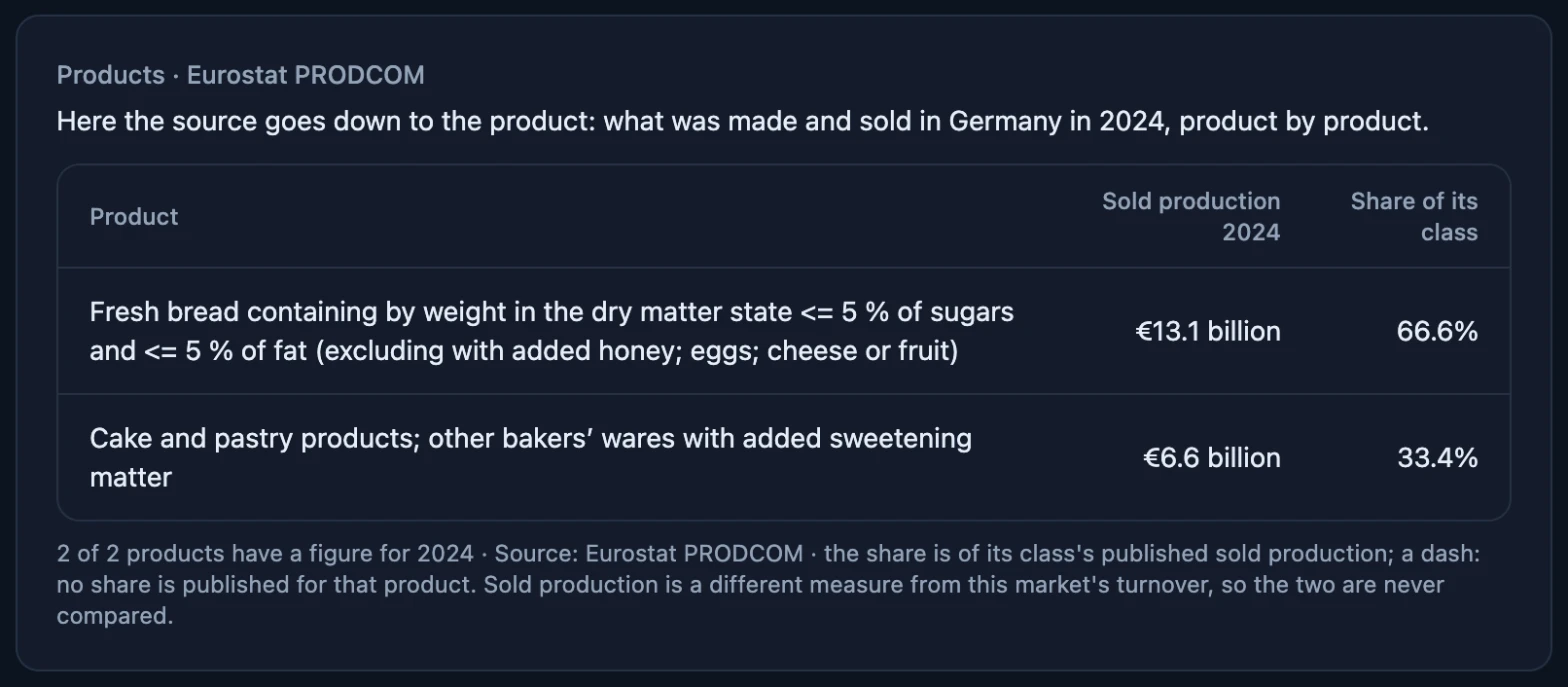
Down to the product: sold production for 4,400 products in 27 countries.
Growth
A report hands you one growth rate and no idea how wrong it could be.
Every series carries its history, so the growth you cite is the growth the official figures show.
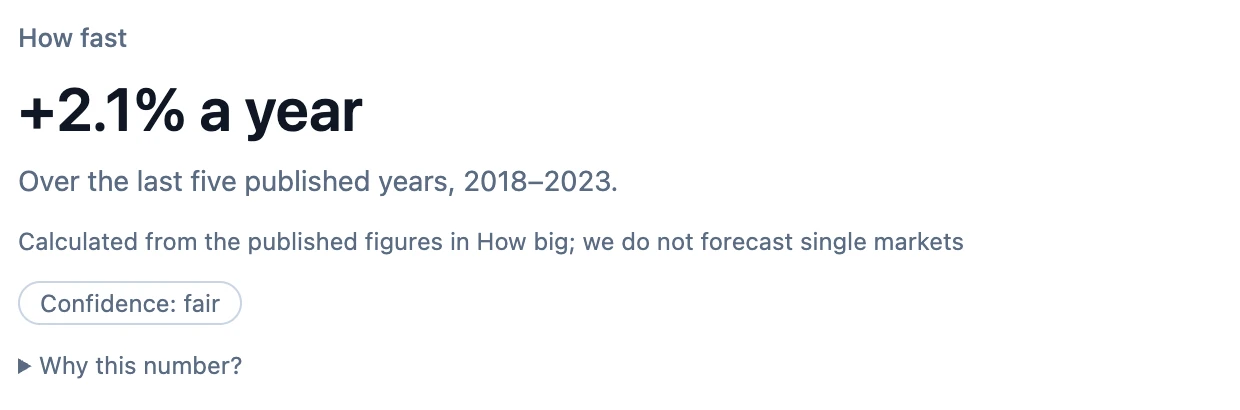
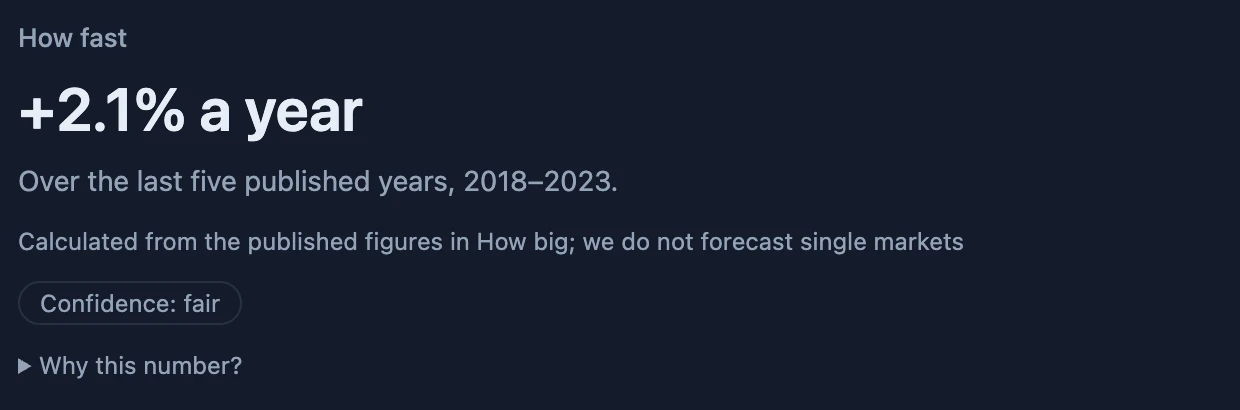
Same market: 23.17 bn EUR in 2018, 25.72 bn in 2023, 2.1 % a year.
Who is already there
How many firms are in the market, how big is the typical one, and how many give up?
The official business registers, read directly: the number of firms, how many start and close each year, how many are still there after five.
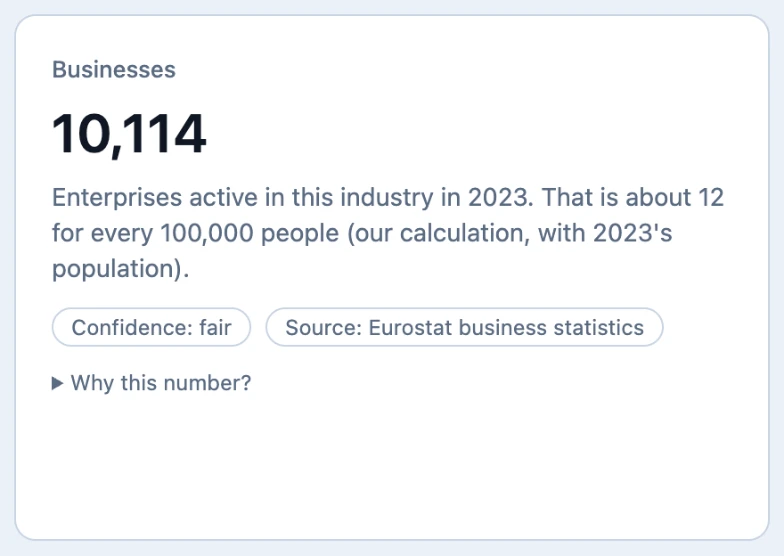
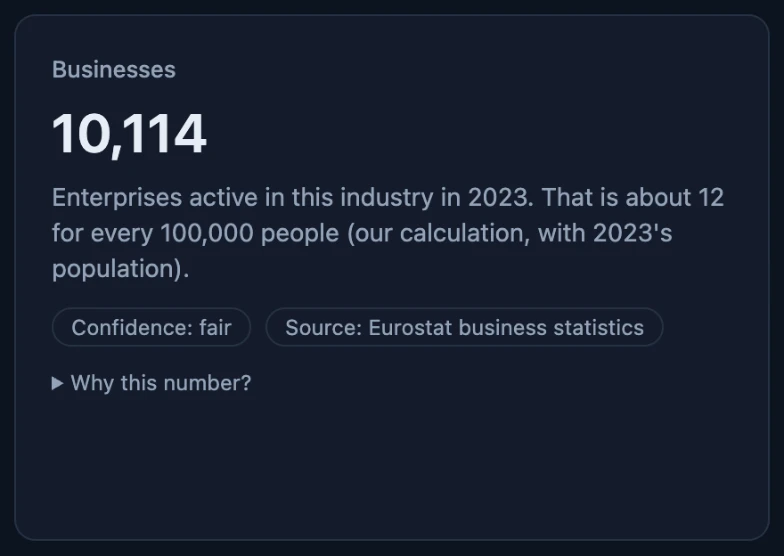
10,114 bakery businesses in Germany. German manufacturing, 2023: 7,957 firms started, 12,015 closed, out of 201,453 active (Eurostat).
Who will buy
Who will buy, and with what.
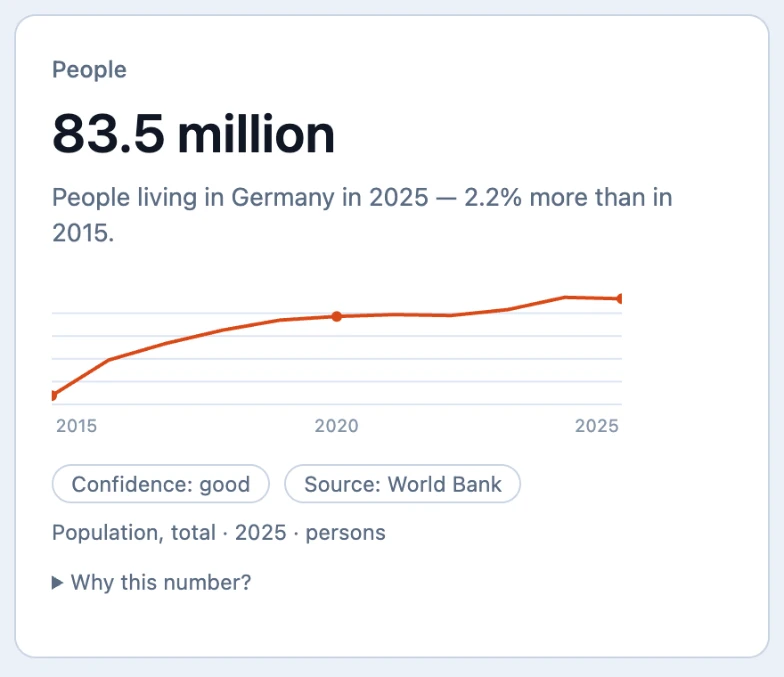
Population, household spending per head, internet use and unemployment for 220 to 265 countries, from the World Bank and the IMF, on the same page as your market.
Germany, 2025: 83.5 million people; 24,108 USD household spending per head; 93.5 % online (2024); unemployment 3.7 %.
Which country, and what could go wrong there
Choosing a country on numbers that were never meant to be compared.
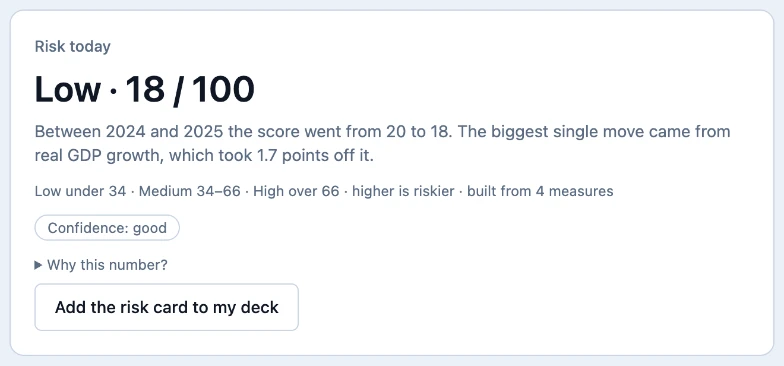
The same official measures for every country, side by side, each with its own source and currency named, and a country-risk score built from four macro inputs, 0 to 100, higher is riskier, with every input shown.
Germany, 2025: risk score 18.3. Scores for 200 countries.
And if it goes the other way
The plan assumes growth. What if growth, inflation or unemployment move?
Three what-if cases for growth, inflation, unemployment and the current account, each built from the measured history and labelled as a scenario, never as a forecast.
Growth scenarios for 239 countries, three cases each.
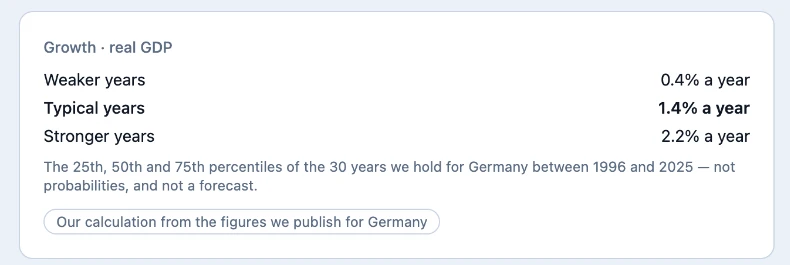
Ask the page
Ask an AI for a market size and you get a confident number with no source.
The assistant on every page reads only the figures the page already serves. It never supplies a number of its own; if a figure is not in the data, the answer says so. Generated prose is labelled as generated.
Where the numbers come from
- Eurostat
- the World Bank
- the IMF
- the OECD
- the UN Statistics Division
- the US Census Bureau
- the US Bureau of Labor Statistics
- the US Bureau of Economic Analysis
- the Office for National Statistics
- Statistics Canada
Every figure carries its source, its date and the grade it was published at. If a number fails our checks, it is withheld and the page says why. We never republish another company's forecast and never resell licensed data.
Into your work
CSV and JSON. The API on Pro, with the same provenance in every object.
Questions people ask
- Where do the numbers come from?
- From Eurostat, the World Bank, the IMF, the OECD and other official publishers, read by us directly. The source is printed on every figure.
- Can I cite this in a deck or a plan?
- Yes. Every figure carries its source and date; the export carries them on every row.
- What if a number is missing?
- Then it is missing on the page too, with the reason. We withhold a figure that fails a check rather than fill it.
- Is the AI making the numbers?
- No. It reads the figures the page serves and answers from them. It never supplies a number of its own.
- Which industries and countries?
- 8,900+ official industry codes across 275 geographies; the deepest coverage in Europe, the UK, the US and Canada, with every country's economy at the top level.
- Is this a report?
- No. It is the figures a report starts from, with their sources, updated when the publisher updates.